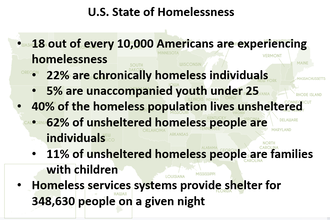
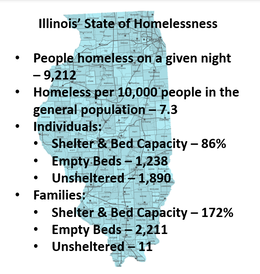
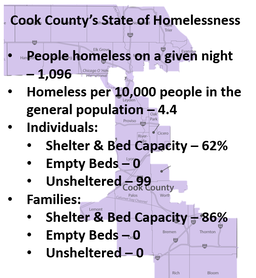
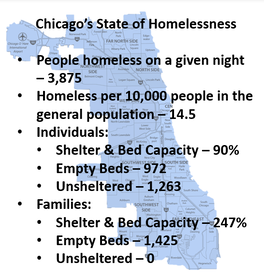
 Data is from the National Alliance to End Homelessness (1). Data is from the National Alliance to End Homelessness (1). by Nathaniel Hagemaster Joining Forces for Affordable Housing provides education resources on affordable housing, homelessness, and related issues. We try to help people stay informed about the need for affordable housing and what can be done. We occasionally post research-based blog posts on the broader scope of homelessness and affordable housing.  Data is from the National Alliance to End Homelessness (2). "Shelter & Bed Capacity" refers to the percentage of people experiencing homelessness a shelter system is able to serve in it's region. Data is from the National Alliance to End Homelessness (2). "Shelter & Bed Capacity" refers to the percentage of people experiencing homelessness a shelter system is able to serve in it's region. *NOTE: All data cited is from the NAEH 2023 State of Homelessness Report (1) unless otherwise noted. Links to all references are at the end of the post. New Report from The National Alliance to End Homelessness In their new report on the current state of homelessness, the National Alliance to End Homelessness indicated that homelessness in the United States was reduced by 17% between 2007 and 2016. However, they also found that it has been on the rise since 2017, with an overall increase of 6% (1). Between 2020 and 2022, the rise in homelessness was unexpectedly small at only 0.3%. This could be because tracking COVID-related changes was difficult, and data collection was disrupted in 2021, which impacted research outcomes. The slight increase in homelessness over these years could also be explained by government actions that helped people get sheltered over quarantine, as well as the eviction moratoria and rental assistance programs that helped to keep people housed when they couldn’t go to work. We have summarized other findings from the report below. Findings on People at Risk of Homelessness The lower a household’s income, the more likely it is that members of that household will become homeless. Another indicator is “housing cost burden”—when a household spends more than 30% of its income on housing. Low-income households that are housing-cost-burdened don’t have the money to pay for unexpected events and emergencies and thus are more likely to lose their housing. Increases in Poverty Before the pandemic, national poverty rates went down over a five-year period, but that streak ended in 2020, with an increase of 3.3 million people living in poverty that year. By the end of 2021, a total of 41.4 million people were living in poverty. Non-white groups have even higher rates of poverty, with black people at 21.8%, American Indian and Alaska Native people at 21.4%, and Hispanics/Latinos at 17.5%, compared to white people at only 9.8% (3). High Levels of Housing Cost Burden The Alliance reported that 7.1 million American households were spending more than 50% of their income on housing in 2021, meaning that they were severely housing cost burdened. In several states, the number of severely housing-cost-burdened households grew at higher rates than the reported national average. For instance, severely housing-cost-burdened households in Wyoming increased by 155% since 2007, 87% in Nevada, 72% in Maryland, and 65% in Hawaii. More Data Needed on the Impact of the Pandemic's End According to the Alliance, progress towards reducing risks of homelessness in America was insubstantial up to the time of the pandemic. Their data does not yet include how the end of pandemic-related rental assistance programs and eviction protections will further increase risks of homelessness, especially with the increased inflation that started in 2022.  Data is from the National Alliance to End Homelessness (2) Data is from the National Alliance to End Homelessness (2) Findings on People Experiencing Homelessness Disparate Impact on People of Color As with poverty, people of color experience homelessness at higher rates than white people. Specifically, the Alliance reported that 11 out of every 10,000 white people experienced homelessness in their study period, while 48 out of every 10,000 black people did. Native Hawaiian and Pacific Islanders experienced the greatest rate of homelessness, at 121 out of 10,000. These groups usually have long histories of experiencing oppression that include displacement from land and property, as well as exclusion from housing opportunities. Other Demographic Findings Of the overall homeless population (including adults and children), 68% of individual homeless people, who are not with families, are men. Men are far more likely to experience homelessness than women, especially men without children, spouses, or other family members. The population of people facing individual homelessness reached 421,392 in 2021. Women (living as individuals and in families with children), as well as transgender, nonbinary, and questioning people are also notably represented within homeless populations. Increases in homelessness have been particularly pronounced among people who are transgender (178%), Asian (36%), American Indian (30%), and Latino (25%). Doubled-Up Households Another indicator of housing hardship and risk of homelessness is the practice of “doubling up,” or sharing housing for economic reasons (4). Doubled-up situations are often unstable and greatly increase the risks of future homelessness. About 3.7 million people were doubled up in 2021. Most notable are the doubled-up population increases found in 2021 in South Dakota (59%) and Maine (36%). Chronic Homelessness It was also found that 22% (or 127,768 people) of the current homeless population are chronically homeless (5), meaning that they’ve experienced homelessness for at least a year or repeatedly experienced homelessness over time. 62% of chronically homeless people live without shelter and often face dire circumstances.  Data is from the National Alliance to End Homelessness (2) Data is from the National Alliance to End Homelessness (2) Findings on People Who Are Unsheltered Homeless services across the country provide shelter for approximately 348,630 people. Shelter bed numbers increased by 7% since 2019, likely due in part to increases in federal funding for additional shelter during the COVID-19 pandemic. However, 40% of people experiencing homelessness spend most of their nights in places like city sidewalks, vehicles, abandoned buildings, parks, benches, tents, etc. Living unsheltered can significantly impact a person’s health and safety. Dramatic Increase in Unsheltered Homelessness Like with most of the Alliance’s data, the number of people living unsheltered has decreased between 2007 and 2015, but the unsheltered population has grown yearly since 2015, amounting to a 35% increase over a seven-year span. Large Impact on Individuals without Children Individuals are more likely to be unsheltered than families. Families with children are often prioritized for services, which means that they are less likely to live unsheltered (at 11%) than individuals (at 51%). Disparity for LGBTQ People Homeless members of the LGBTQ community are more likely to be unsheltered than people who identify as heterosexual and/or cisgender. Prejudices and discrimination against this community, as well as the fact that many LGBTQ people don’t typically have children or close relatives, are causes of unsheltered homelessness among queer people. Unsheltered homelessness in the transgender community has increased to 231% since 2015. Impact of Regional Housing Crises The prominent affordable housing crises on the west coast (in California, Oregon, Washington, and Hawaii) seem to explain increases in unsheltered homelessness for Asian people (83%), Latino people (77%), and American Indian people (61%), as well as members of the trans community since these states are highly populated by members of these communities. Findings on Veterans Encouragingly, veteran homelessness seems to be on the decline. Between 2010 and 2020, the homeless veteran population decreased by 50%. In addition, a total of 83 communities and 3 states have ended homelessness among veterans. This can be explained by the many strategies and efforts, both by the government and other entities, that have successfully focused on and helped veterans find and sustain stable housing. The Alliance claimed that similar attention and resources could be extended to other groups with high rates of homelessness to find similar success within different communities. References (1) National Alliance to End Homelessness. (2023). “State of Homelessness: 2023 Edition.” National Alliance to End Homelessness. National Alliance to End Homelessness. Retrieved on July 10, 2023, from: https://endhomelessness.org/homelessness-in-america/homelessness-statistics/state-of-homelessness/ (2) National Alliance to End Homelessness. (2023). “State of Homelessness: 2023 Edition - Illinois, Cook County, and Chicago.” National Alliance to End Homelessness. National Alliance to End Homelessness. Retrieved on July 10, 2023 https://endhomelessness.org/homelessness-in-america/homelessness-statistics/state-of-homelessness-dashboards/?State=Illinois (3) U.S. Census Bureau (2021). Table S1701, poverty status in the past twelve months, 2021: American Community Survey 1-year estimates subject tables. Retrieved on July 15, 2023, from: https://data.census.gov/table?text=poverty&t=Official+Poverty+Measure:Poverty&g=010XX00US&tid=ACSST1Y2021.S1701 (4) Goodwin, J, and Blythe, Y. (2020, June 3). “Understanding Doubled-Up” Webinar. National Center for Homelessness Education. National Center for Homelessness Education. Retrieved on July 10, 2023 from: https://nche.ed.gov/understanding-doubled-up/ (5) National Alliance to End Homelessness. (April 2023). “Chronically Homeless.” National Alliance to End Homelessness. National Alliance to End Homelessness. Retrieved on July 10, 2023, from: https://endhomelessness.org/homelessness-in-america/who-experiences-homelessness/chronically-homeless/#:~:text=Chronic%20homelessness%20is%20used%20to,use%20disorder,%20or%20physical%20disability
0 Comments
Leave a Reply. |
|
© COPYRIGHT 2018. ALL RIGHTS RESERVED.
|


